Pivots
Pivots are essential for anyone in the organization who wants to check out events and user segments side by side and be able to play around with data where they can check a key event against multiple segments, grouped by campaigns or countries or vice versa.
The dominant user for this function ends up being the product manager, however marketers use this function to understand how their spends are impacting key events against key segments within the company.
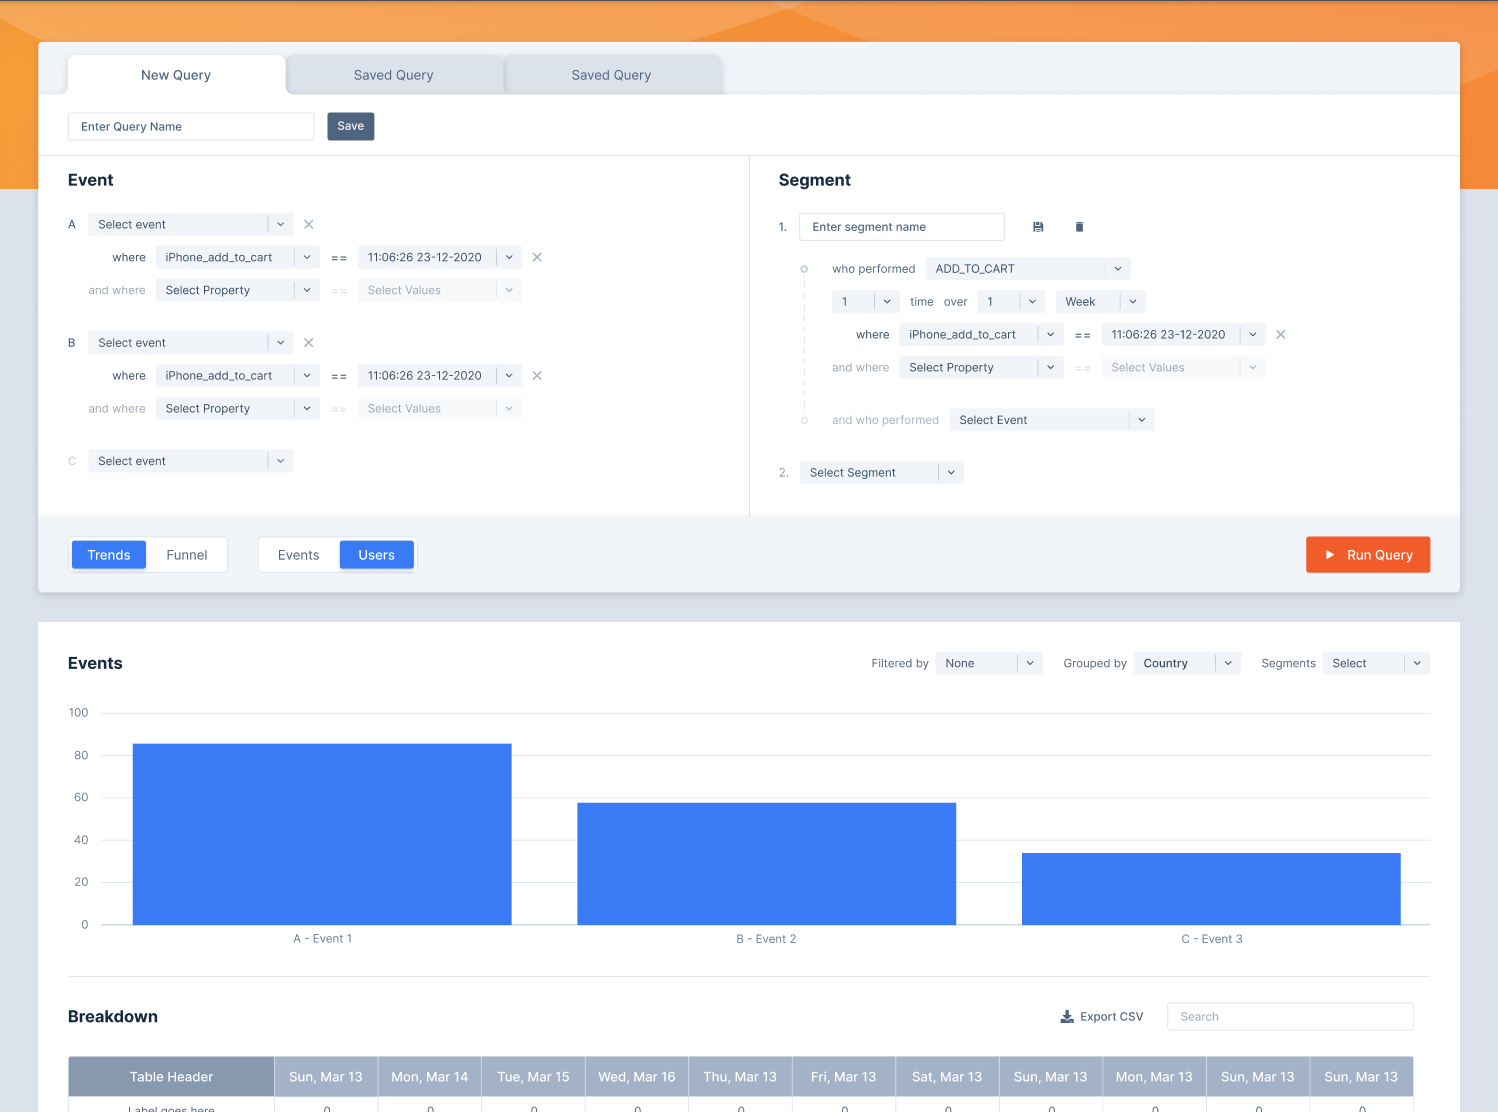
Figure: Pivoting between events and user segments
Anyone in your enterprise can rely on pivots to be able to build any chart but with significant side by side views of how various user clusters behave against connected and non connected events, and run correlation analysis against each of them.
Any pre-saved segment by the user or the enterprise is available to ensure work can be reused and the query for the pivots are persisted automatically so no data is lost.
Pivots are supported in two workspace areas;
- Enterprise space where astute BI personnel can create permanent views that can be shared across every employee
- Alternatively, folks who want to create their own version can create clones to their personal workspaces and play with them
In both cases, the state for the pivot setup is saved.